共计 2328 个字符,预计需要花费 6 分钟才能阅读完成。
实验采用的数据是周志华老师的机器学习清华版教材,这本书不错,好顶赞
Matlab
close all;
clc;

density = [0.697, 0.774, 0.634, 0.608, 0.556, 0.403, 0.481, 0.437, 0.666, 0.243, 0.245, 0.343, 0.639, 0.657, 0.360, 0.593, 0.719];
density = density';
sugar = [0.460, 0.376, 0.264, 0.318, 0.215, 0.237, 0.149, 0.211, 0.091, 0.267, 0.057, 0.099, 0.161, 0.198, 0.370, 0.042, 0.103];
sugar = sugar';
y = [1, 1, 1, 1, 1, 1, 1, 1, 0, 0, 0, 0, 0, 0, 0, 0, 0];
y = y';

x = [ones(size(y,1),1) density  sugar];
[m,n] = size(x);

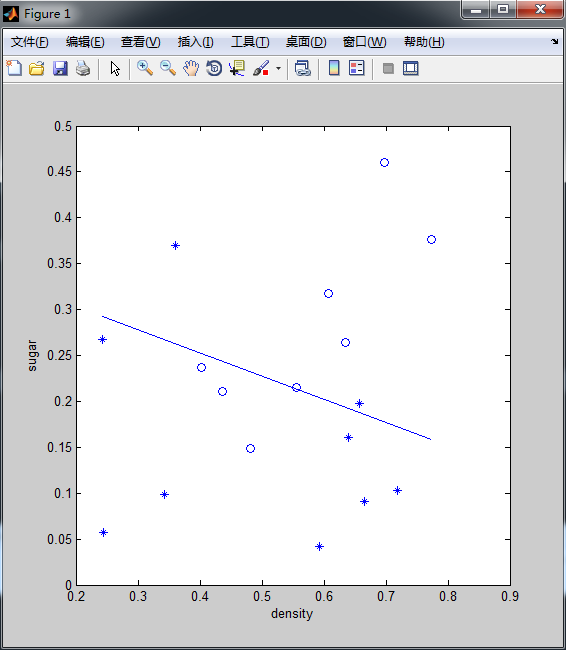
figure,
pos = find(y);
neg = find(y==0);
plot(x(pos,2),x(pos,3),'o');
hold on
plot(x(neg,2),x(neg,3),'*');
xlabel('density'),ylabel('sugar');


theta = zeros(n,1);
MaxIter = 10;
J=zeros(MaxIter,1);

for i=1:MaxIter
    z = x*theta;
    h = logsig(z);

    grad = 1./m*x'*(h-y);
    H = (1/m).*x' * diag(h) * diag(1-h) * x;
    theta = theta-H\grad;

    J(i) = 1/m*sum(-y.*log(h)-(1-y).*(log(1-h)));
end

hold on
plot_x = [min(x(:,2)),max(x(:,2))];
plot_y = (-1/theta(3))*(theta(1)+theta(2)*plot_x);
plot(plot_x,plot_y);

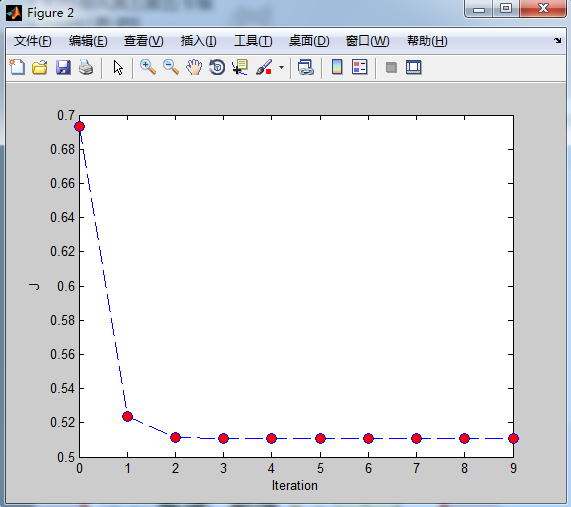
figure,
plot(0:MaxIter-1,J,'o--', 'MarkerFaceColor', 'r', 'MarkerSize', 8)
xlabel('Iteration'); ylabel('J')对应的偏差如下
# -*- coding: utf-8 -*-
import numpy as np
import matplotlib.pyplot as plt
def sigmoid(inX):
    return 1.0/(1+np.exp(-inX))
wm_sugar=np.array( [0.460, 0.376, 0.264, 0.318, 0.215, 0.237, 0.149, 0.211, 0.091, 0.267, 0.057, 0.099, 0.161, 0.198, 0.370, 0.042, 0.103])
wm_density=np.array([0.697, 0.774, 0.634, 0.608, 0.556, 0.403, 0.481, 0.437, 0.666, 0.243, 0.245, 0.343, 0.639, 0.657, 0.360, 0.593, 0.719])
wm_lable=np.array([1, 1, 1, 1, 1, 1, 1, 1, 0, 0, 0, 0, 0, 0, 0, 0, 0])
wm_lable.shape=(1,17)
t_lable=np.transpose(wm_lable)
x=np.array([np.ones(np.size(wm_lable,1)),wm_sugar,wm_density])
x_shape=np.shape(x)
#绘图
plt.figure(1)
pos=wm_lable==1
neg=wm_lable==0
plt.plot(x[1,pos[0,:]], x[2,pos[0,:]],'bx')
plt.hold(True)
plt.plot(x[1,neg[0,:]], x[2,neg[0,:]],'b*')
plt.xlabel('sugar')
plt.ylabel('density')
plt.hold(True)

# 开始牛顿法计算
theta=np.zeros([x_shape[0],1])
MaxIter = 10;
J=np.zeros([MaxIter,1]);

for i in range(MaxIter):
    z = np.dot(np.transpose(x),theta)
    h = sigmoid(z)

    grad = 1.0/x_shape[1]*np.dot(x,(h-np.transpose(wm_lable)));
    H = (1.0/x_shape[1])*np.dot(x,np.dot(np.diag(h[:,0]),np.dot(np.diag(1-h[:,0]),x.T)))
    theta = theta-np.linalg.solve(H, grad)

    J[i]= 1.0/x_shape[1]*sum(-t_lable[:,0]*np.log(h[:,0])-(1-t_lable[:,0])*(np.log(1-h[:,0])));
plot_x = np.array([np.min(x[1,:]),np.max(x[2,:])])
plot_y = (-1/theta[2])*(theta[0]+theta[1]*plot_x);
plt.plot(plot_x, plot_y)
plt.show()
plt.figure(2)
plt.plot(np.linspace(1, MaxIter, MaxIter),J)
plt.xlabel('Iteration');
plt.ylabel('J')
plt.show()正文完
请博主喝杯咖啡吧!


