共计 954 个字符,预计需要花费 3 分钟才能阅读完成。
现在TensorFlow是机器学习中最常用的库之一。有时,描述张量图可能是非常有用的,并且知道什么操作需要更多的时间和更少的时间。这可以用张量流timeline模块完成。
- 如何执行张量流代码的分析。
- 如何从多次会话运行合并时间轴。
- 分析期间可能会出现什么问题,以及如何解决问题
使用Timeline对象来获取图中每个节点的执行时间:
- 你使用一个经典的,
sess.run()但也指定可选的参数options和run_metadata - 然后
Timeline使用run_metadata.step_stats数据创建一个对象
这是一个测量矩阵乘法性能的示例程序:
import tensorflow as tf
from tensorflow.python.client import timeline

x = tf.random_normal([1000, 1000])  # 随机矩阵1000*1000
y = tf.random_normal([1000, 1000])
res = tf.matmul(x, y)

# Run the graph with full trace option
with tf.Session() as sess:
    run_options = tf.RunOptions(trace_level=tf.RunOptions.FULL_TRACE)
    run_metadata = tf.RunMetadata()
    sess.run(res, options=run_options, run_metadata=run_metadata)

    # Create the Timeline object, and write it to a json
    tl = timeline.Timeline(run_metadata.step_stats)
    ctf = tl.generate_chrome_trace_format()
    with open('timeline.json', 'w') as f:
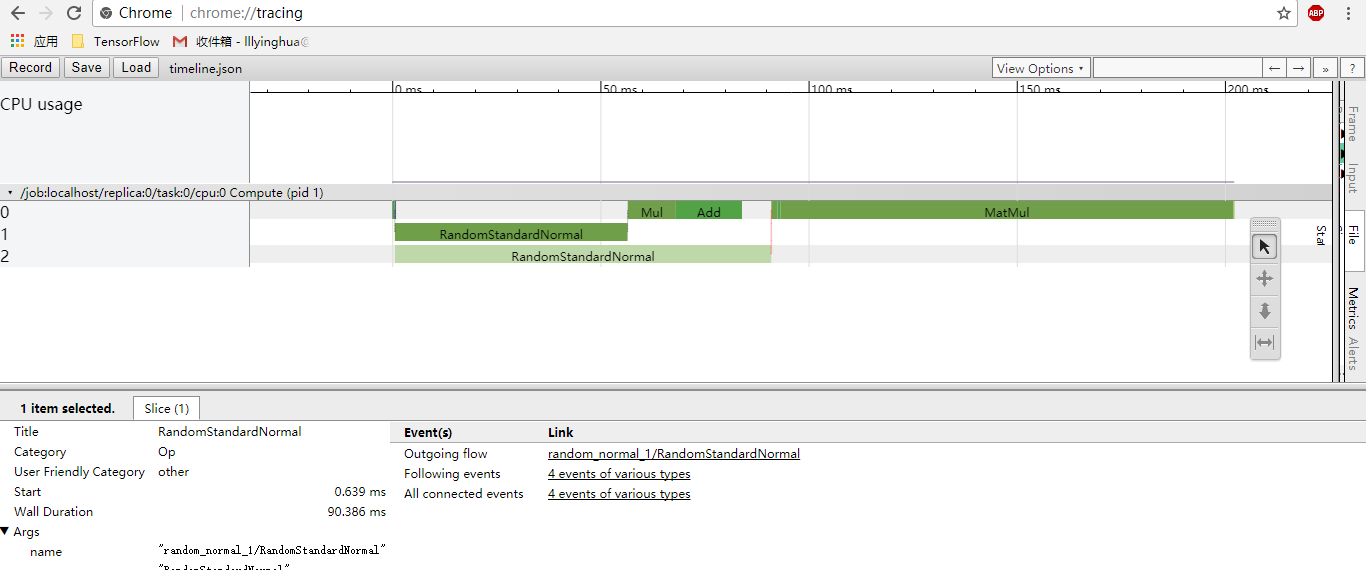
f.write(ctf)会生成一个timeline.json文件,然后,打开Google Chrome,转到该页面chrome://tracing并加载该timeline.json文件。看到像:
在顶部您将看到以ms为单位的时间轴。要获得有关操作的更准确的信息,只需点击它。还有在右侧,有简单的工具存在:选择,平移,缩放和时间。
正文完
请博主喝杯咖啡吧!


